Visualization
Now we come to the best part - looking at your results!
If you're proficient in python or R this step can be skipped and you can
roll your own visualization method with the results.gene_results.tab and
results.sgrna_results.tab dataframes.
But if you're looking for a quick visualization toolkit you can use my tool
screenviz
Installation
You can install it straight from github with the python package manager pip
pip install git+https://github.com/noamteyssier/screenviz
Usage
Gene Analysis
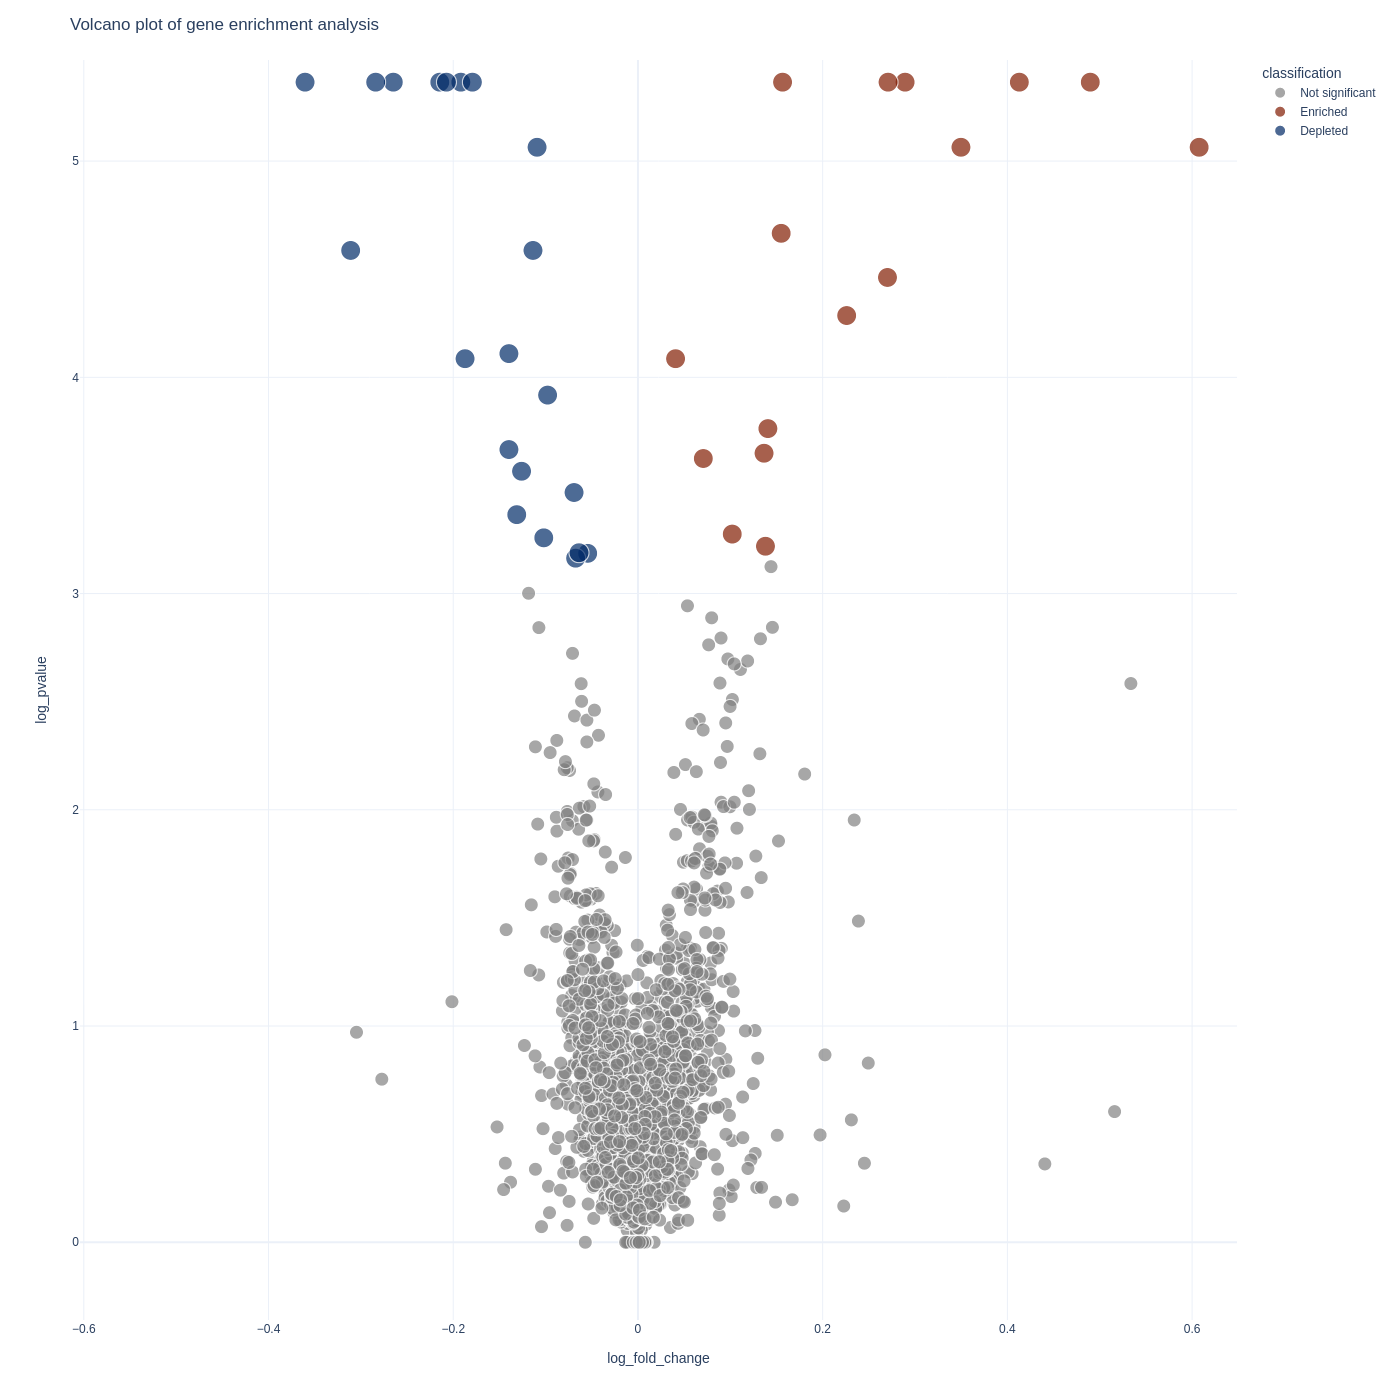
To visualize your gene-level results you can use the screenviz gene subcommand:
screenviz gene -i results.gene_results.tab
This will write the visualization to a file gene_volcano.html which you can open
in your favorite browser to interact with:
firefox gene_volcano.html

sgRNA Analysis
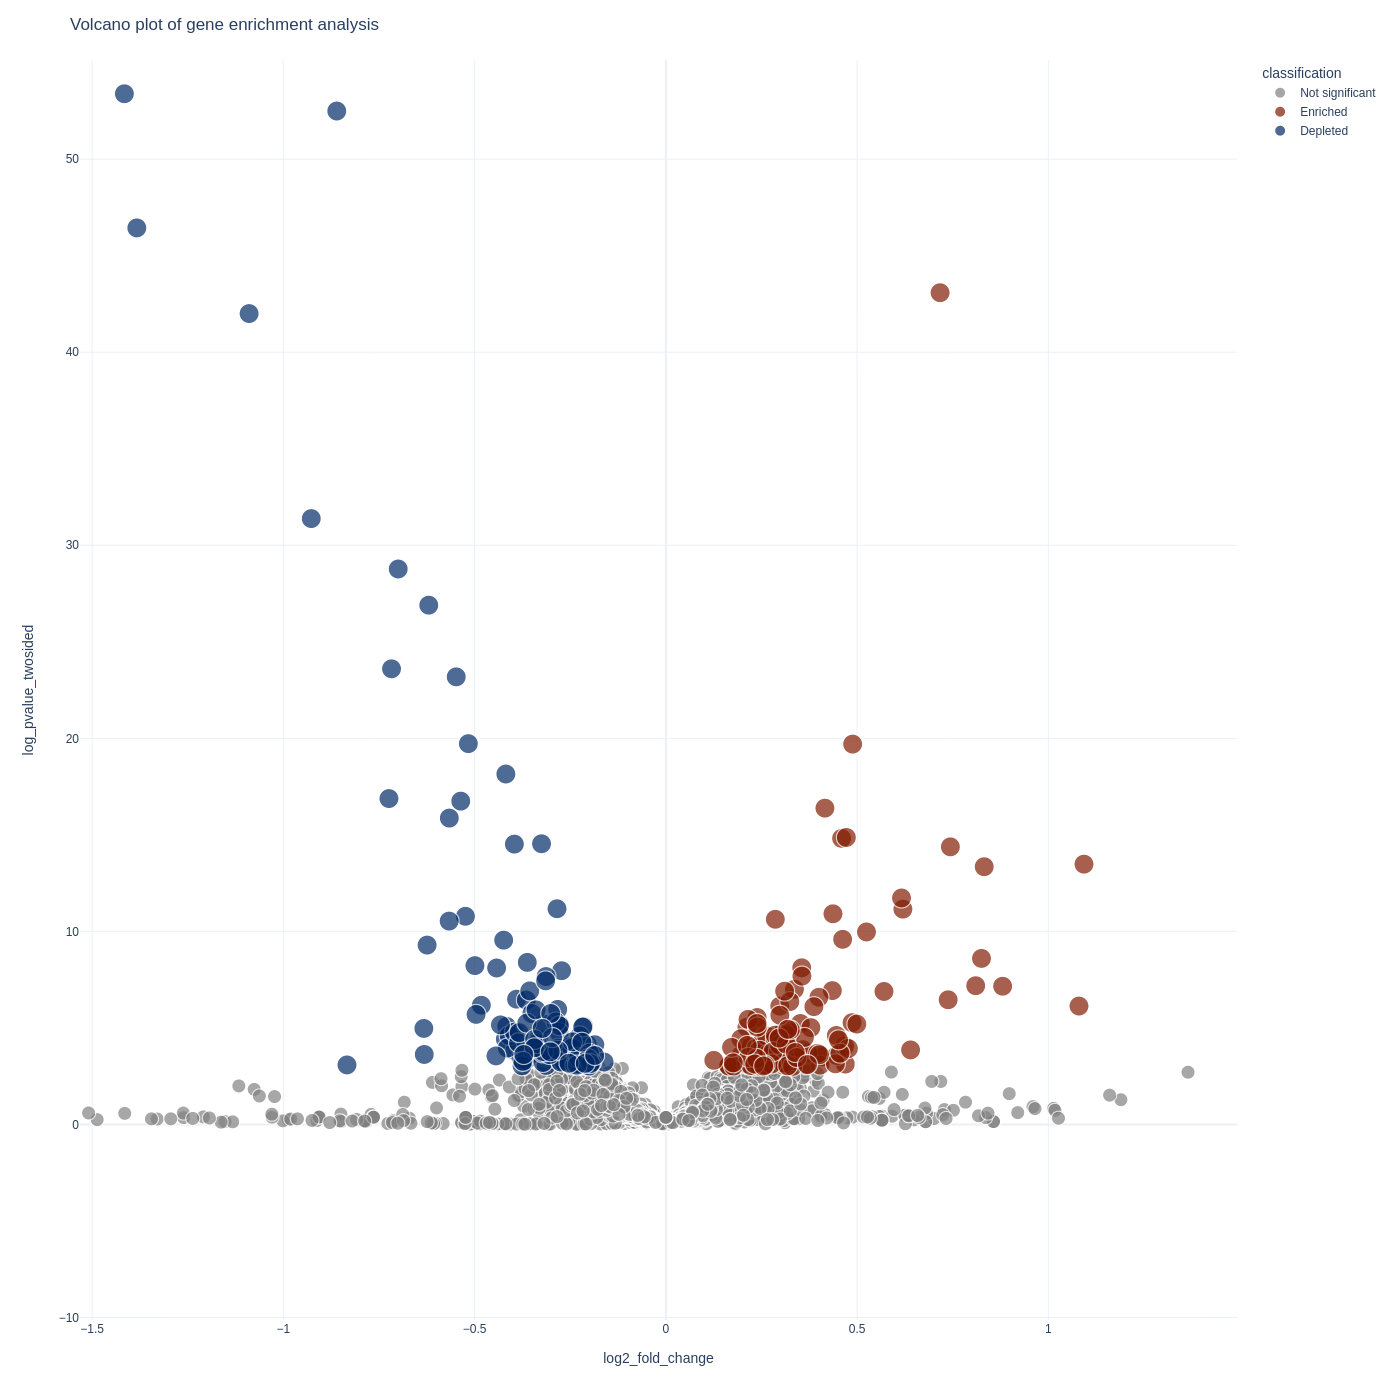
To visualize your sgrna-level results you can use the screenviz sgrna subcommand:
screenviz sgrna -i results.sgrna_results.tab
This will write the visualization to a file sgrna_volcano.html which you can open
in your favorite browser to intract with:
firefox sgrna_volcano.html
